
It should not be that confusing but most of the time when
someone asks me to calculate the specificity or the sensitivity of the accuracy
of a model, I just end up googling the formulas. Confusion Matrix is basically
used to figure out which of our classification models (Logistic Regression, KNN, or Random Forest) are better in classifying the data. Let’s suppose we have
data for weight, blood circulation, heart rate, blocked arteries, etc. for the number of patients for which we have to predict whether the patient has heart
disease or not. On the data, we will run our classification models like Logistic
Regression or K-NN by dividing the data into Training and Test Data.
The process goes like we first train the model and then test
it to predict the outcome. Now, to summarize how different models performed, we
use the confusion matrix. The Confusion Matrix will look like the below image.
The columns are the actual values of the patients while rows are the predicted
values of the model.

Confusion Matrix True Positives (TP) is the number of times
the model predicted correctly that the patient has heart disease. True
Negatives (TN) are the number of times the model predicted correctly that the
patient doesn’t have heart disease. False Positive (FP) is the number of
times the model predicted that patient has a heart disease but in actual they
don’t. False Negative (FN) is the number of times the model predicted that
patient doesn’t have heart disease but in actual they do have.
Now, let’s suppose we did the classification for 100
patients and below is how the confusion matrix looked like in case of Logistic
Regression.
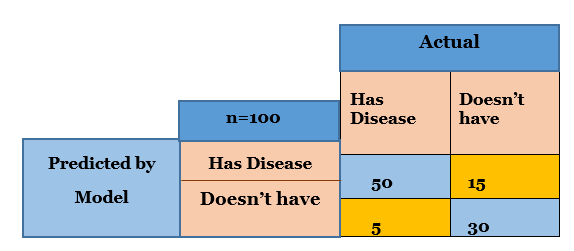
Now, we can calculate the accuracy, specificity, or the sensitivity of the model.
Accuracy or Precision = (TP+TN)/Total = (50 +30)/100 = 0.80
This tells us how often the classifier is correct.
Sensitivity = TP/ (TP+FN) = 50 / (50+5) = 0.909 i.e. approx.
91% of the time patients with heart disease were correctly identified.
Specificity = TN/ (TN+FP) = 30/ (30+15) = 0.66 i.e. approx.
67% of the time patients without heart disease were correctly identified.
We can then calculate the values in the same way for the K-NN
method or other classification methods. Then on the basis of what is more
important to us i.e. patients getting identified correctly with heart disease,
the model with higher sensitivity should be used. And if we intend to see
patients without heart disease getting correctly classified then the model with
higher specificity should be chosen.


No comments:
Post a Comment