
Flutter Emulator Debugging VSCode
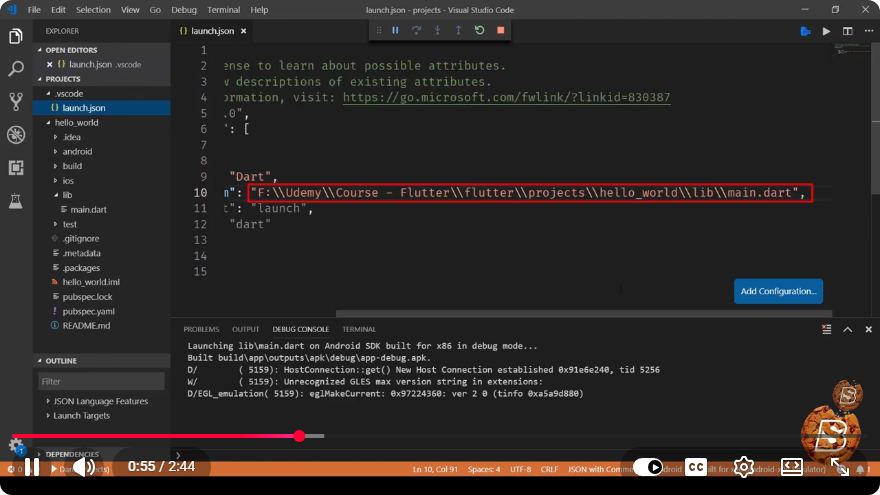
Flutter Emulator Debugging in VSCode: A Quick Guide
In the fast-paced world of mobile app development, debugging can often feel like a daunting task. However, with the right tools and techniques, you can simplify this process significantly. In this post, we'll explore how to effectively debug your Flutter applications using Visual Studio Code (VSCode). This guide is based on the YouTube video titled "Flutter Emulator Debugging VSCode" and will cover essential steps to get you started in just a few minutes.
Prerequisites
Before diving into debugging, ensure you have the following:
- Flutter SDK: Make sure you have Flutter installed on your machine. You can download it from the official Flutter website.
- Visual Studio Code: Download and install VSCode from the official site.
- Flutter and Dart Extensions: Install the Flutter and Dart extensions in VSCode to enable Flutter development features. You can find these in the Extensions Marketplace within VSCode.
Setting Up Your Environment
1. Create a New Flutter Project
To start debugging, you'll need a Flutter project. Create a new Flutter project by running the following command in your terminal:
flutter create my_project
This command will create a new directory called my_project containing the Flutter starter template.
2. Open the Project in VSCode
Navigate to your project directory and open it in VSCode:
cd my_project
code .
This will open the project in Visual Studio Code, where you can start coding and debugging.
Launching the Emulator
1. Start the Android Emulator
To debug your Flutter application, you need to have an emulator running. You can start it from the terminal using:
flutter emulators --launch <emulator_id>
Alternatively, if you have Android Studio installed, you can launch the emulator from there.
2. Select the Emulator in VSCode
Once the emulator is running, ensure that VSCode is set to use it. You can select the running emulator from the bottom bar in VSCode, where the device name is displayed. Click on it to see a list of available devices and select your emulator.
Debugging Your Flutter Application
1. Set Breakpoints
Debugging begins with setting breakpoints in your code. To do this, navigate to the file you want to debug and click in the gutter (the vertical bar to the left of the line numbers) next to the line where you want to pause execution. A red dot will appear, indicating a breakpoint has been set.
2. Start Debugging
With your breakpoints set, you can start debugging your application. Press F5 or go to the Debug menu and select "Start Debugging." This will launch your app in the emulator and pause execution at the breakpoints you've set.
3. Use the Debugger Features
Once your application hits a breakpoint, you can use various debugging features:
- Step Over (F10): Execute the next line of code without stepping into function calls.
- Step Into (F11): Dive into the function call to see its execution.
- Step Out (Shift + F11): Exit the current function and return to the calling function.
- Continue (F5): Resume execution until the next breakpoint.
4. Inspect Variables
In the Debug sidebar, you will find a section for variables. Here, you can inspect the current state of your variables, evaluate expressions, and even modify variable values on the fly to test different scenarios.
Conclusion
Debugging Flutter applications in VSCode can be a straightforward process when you know the steps to follow. By setting up your environment correctly, launching your emulator, and utilizing the debugging tools available in VSCode, you can streamline your development workflow and enhance your productivity.
With practice, you'll become proficient at identifying and resolving issues in your code, allowing you to focus on building great applications. Happy coding and debugging!
Connect with SkillBakery Studios
Explore more tutorials, tools, and resources:
Posted by SkillBakery Studios


 Hello, my name is Jack Sparrow. I'm a 50 year old self-employed Pirate from the Caribbean.
No comments:
Post a Comment